Skip to content
New issue

Have a question about this project? Sign up for a free GitHub account to open an issue and contact its maintainers and the community.

By clicking “Sign up for GitHub”, you agree to our terms of service and privacy statement. We’ll occasionally send you account related emails.

Already on GitHub? Sign in to your account

JavaScript Charts #2431

Closed
timo-bes opened this issue May 16, 2011 · 35 comments
Closed

JavaScript Charts #2431

timo-bes opened this issue May 16, 2011 · 35 comments
Labels
Critical Indicates the severity of an issue is very critical and the issue has a very high priority. Enhancement For new feature suggestions that enhance Matomo's capabilities or add a new report, new API etc.
Milestone

Comments

@timo-bes
Copy link
Member

Provide charts (pie, bar and evolution) rendered by JavaScript rather than Flash.

Suggested library: jqplot (http://www.jqplot.com)

  • Open source and free
  • Updated frequently
  • Highly customizable

Open questions

  • Do we add JS charts in addition to or instead of Flash?
@timo-bes
Copy link
Member Author

Here's a first proof of concept implementation.

In your config.ini, add

[General]
use_js_charts = 1

Apply the diff and place the contents of jqplot-src.zip in libs/jqplot/src/

@timo-bes
Copy link
Member Author

Attachment:
jqplot-src.zip

@timo-bes
Copy link
Member Author

Attachment:
diff.zip

@timo-bes
Copy link
Member Author

Sorry for adding the diff as a zip, trac wouldn't accept it otherwise

@robocoder
Copy link
Contributor

No worries. It's the spam filter at work.

Looking at the patch:

  • libs/jqplot.{css, js} - should probably be in plugins/CoreHome/templates/
  • libs/jqplot/src/* - could be moved up one level to libs/jqplot/

Otherwise I don't see a blocker for commiting to trunk.

@mattab
Copy link
Member

mattab commented May 16, 2011

quick review

  • great work, long due change to JS graphs that will make a lot of users happy!!
  • please remove examples/, docs/ directory (and all other files not required by Piwik to keep size minimal and other risks associated with unused files)
  • also remove jquery etc. as they are already packaged in piwik
  • I vote for removing OFC from trunk as long as all features are supported. Better keep code simpler. Also, 1.5 will have probably a long RC cycle to iron out all new features, so we will have many testers and will find most bugs if there are any.
  • have you tried if ExampleUI plugin still work fine (it demonstrates how to use graphs in a plugin, to plot external data in a plugin) ? It would be great if the API was still working the same way. There is for example a graph that plots several lines which isn't used in Piwik core, but is used in other plugins (SiteSearch for example I think ;)

@robocoder
Copy link
Contributor

Oh, I see "Export as Image" isn't implemented yet.

@mattab
Copy link
Member

mattab commented May 17, 2011

Currently, if you click on a sparkline, it will refresh the Evolution graph at the top of the page with the metric clicked on. Is this also working with JS charts?

I'm thinking that it will be easier also to add a list of metrics on the right of the graph, to select which metric to plot (#1820) once we use JS and not flash :)

@timo-bes
Copy link
Member Author

Thanks for pointing that out, matt.

I have thought of that and in the current version on my local machine (which I will commit soon), clicking the sparklines works. It would be easy to implement a jquery event that can be triggered on the container and receives a data url which will be plotted. That could be used in a select element...

@mattab
Copy link
Member

mattab commented May 17, 2011

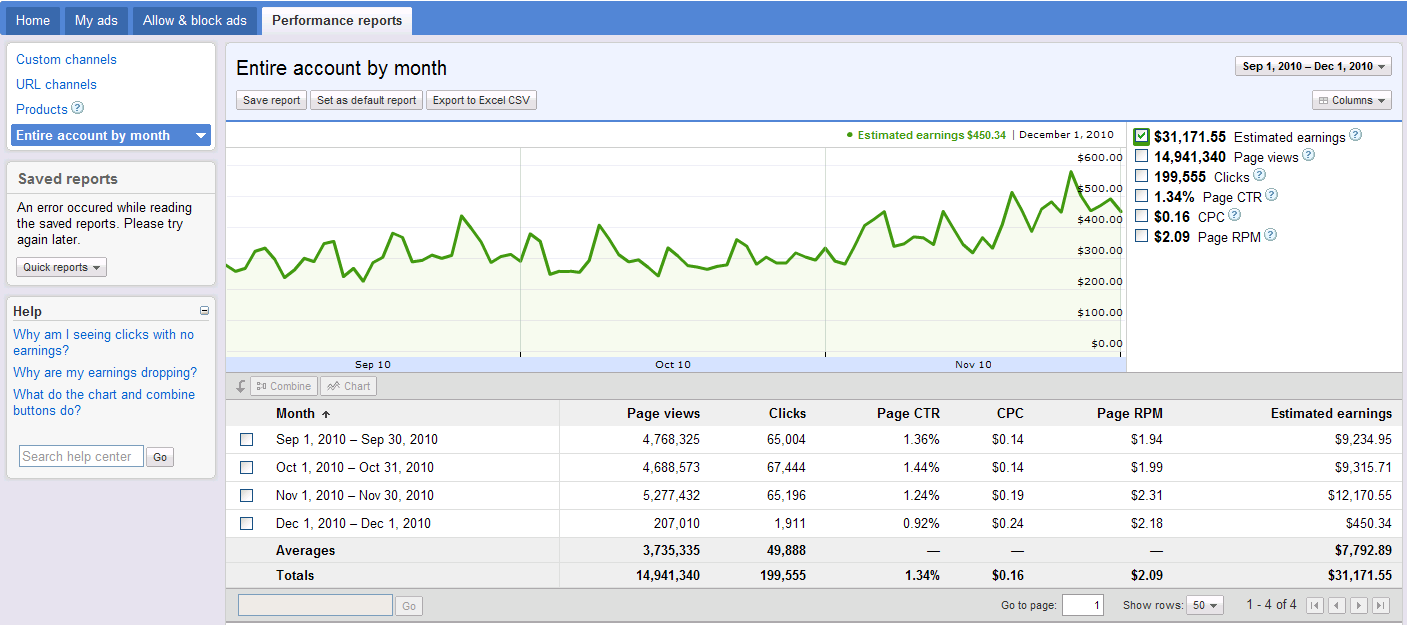
Cool! Instead of a SELECT, I was thinking more of a showing the list of all metrics a bit like google adsense graphs: http://2.bp.blogspot.com/_YbURk67VlGk/TUdM5dkPLVI/AAAAAAAABWU/sDd80kcjJWA/s1600/%25233Graphs_EN.PNG

We could use a Radio button instead of checkbox to keep things simple (click on checkbox would refresh the line)

@timo-bes
Copy link
Member Author

(In [4724]) refs #2431 Basic JavaScript Chart support using jqplot

@timo-bes
Copy link
Member Author

(In [4725]) refs #2431 removed loading JS on the fly

@timo-bes
Copy link
Member Author

(In [4734]) refs #2431 LEGALNOTICE, Export as Image translated, removed some unneeded JS

@timo-bes
Copy link
Member Author

(In [4789]) refs #2431 new legend renderers: nicer for line chart, available for bar chart, inside pie chart. also fixes image export problems.

@timo-bes
Copy link
Member Author

(In [4790]) refs #2431 show loading feedback when clicking on sparklines

@timo-bes
Copy link
Member Author

(In [4800]) refs #2431 memory leak fixes (temporarily removed jqplot due to problems with svn)

@timo-bes
Copy link
Member Author

(In [4801]) refs #2431 added jqplot again

@mattab
Copy link
Member

mattab commented May 24, 2011

(In [4802]) Refs #2431 - Alerting "please upgrade your browser" when click on export as image not supported

@mattab
Copy link
Member

mattab commented May 24, 2011

OK great improvements... I looked at our earlier discussions and all is now implemented and looking great!! :)
I think the last UI "regression" is:

  • When the evolution chart is clickable (when period != range currently), it would be usable to have the cursor be of type pointer to show that it's clickable
  • Pie chart 100% appears as a square filling all the graph

I still have a bit of feedback on leaks (sorry!):

  • Much less memory leaks, but still quite present. After usink piwik for 5 minutes, loading around 10 reports, I see 100M memory leak in FF
  • Tooltips are leaking, if you hover on evolution chart the memory grows and is not freed. In firefox, it leaks at about 1M per second when constantly hovering on evolution chart. The same happens for Pie charts and bar graphs.
  • In IE, if you hover from left to right on evolution chart, the browser becomes quite slow and uses 100% of proc, so I assume the memory and maybe events binding are not reset for tooltips? NOTE: I'm using IE8 which maybe is using excanvas (but I think it might be related to previous point about leaking tooltips anyway)
  • Maybe some of the memory logic is browser dependant... Chrome appears to be using a LOT less memory and leaking nearly none (appart from tooltips)?

and I think the last task is...

  • Remove OFC library from the trunk, remove all OFC custom PHP code and use only jqplot as graph library.

@timo-bes
Copy link
Member Author

About the tooltip leaks: I did lots of tests and came to the conlusion, that there are no major leaks we can fix anymore. The problem is much worse if Firebug is enable, so make sure it's not.

Here's some more info:

  • Firefox and Safari handle the charts the same way. Safari does not leak at all.
  • Other graph libs have the same problem in Firefox.
  • Firefox uses the most memory out of all browsers. It doesn't handle canvases well. This will definately be improved in future versions of Firefox.
  • By clicking around a lot you can up the mem usage about 50 to 100MB compared to when you first open the dashboard. Some of that memory will be freed after some time. That is a lot, but I don't see how we can influence it. Btw, in Safari it's 15MB.

Before the leak fixes, you could up the mem usage as much as you wanted, now it at least has reasonable upper bounds.

About IE: excanvas uses a lot of CPU, but I can't influence that either. It is very memory efficient though, because the canvases can be properly destroyed. If it's slow in IE8, it might show people how crappy that browser is and maybe they update to IE9, which works perfectly fine (and has a way better canvas imlementation than Firefox).

Over the course of the jqplot integration I realized that the canvas technology is still at it's very beginning. Maybe we are a few months ahead of our time, but I think it's a good thing to propagate new technology and maybe help users see how outdated their browsers are. There are modern browsers, why not use them?

If there is a good reason to continue using old browsers, everything works fine, it might just be a little slow (which Flash was as well).

There are some more things on my to do list:

  • Export as image has to disabled for IE7 & 8, becuase excanvas does not support that. Later, we can replace that with the ImageGraph library.
  • There is a little bug on the overview pages with sparklines: If you open an empty report, you can't switch anymore.
  • Excanvas should be included conditionally. Is there a way to do that? (Conditional comments don't work when merging JS)

@robocoder
Copy link
Contributor

re tooltip/hover leak. Read some posts that suggest using a timer to blur focus of the canvas element periodically (eg every 200 ms) to trigger Firefox's garbage collector.

@robocoder
Copy link
Contributor

re: conditional include, see plugins/CoreHome/templates/header.tpl

@timo-bes
Copy link
Member Author

re tooltip/hover leak: Can you share the posts?

I doubt the problem are still the canvases. They are properly reused (which is what my fix is all about).

For testing I disabled the tooltip and the color changes. The memory still grows. I think, it's just the enourmouse amounts of mousemove events...

@timo-bes
Copy link
Member Author

To illustrate how crappy Firefoxes memory management is: Try refreshing the page a couple of times...

@timo-bes
Copy link
Member Author

(In [4807]) refs #2431 excanvas is only loaded in old internet explorers. also minified excanvas.

@timo-bes
Copy link
Member Author

(In [4808]) refs #2431 removed unneeded jqplot files. reduced jqplot css size. cursor pointer for clickable evolution charts. small sparkline bugfix.

@timo-bes
Copy link
Member Author

The pie chart bug has been reported to Chris. He will fix it.

Apart from that, everything should finally be done now!

As I said, there still are memory problems in Firefox which I think we won't be able to fix. Are we comfortable with removing OFC from trunk at this stage or should we keep it until Firefox improves its canvas implementation (or we realize that it is our fault after all)?

@mattab
Copy link
Member

mattab commented May 25, 2011

Export as image has to disabled for IE7 & 8, becuase excanvas does not support that. Later, we can replace that with the ImageGraph library.
We could, but really low priority. IE7/8 can die ;)

There is a little bug on the overview pages with sparklines: If you open an empty report, you can't switch anymore.
OK not a problem

Are we comfortable with removing OFC from trunk at this stage or should we keep it until Firefox improves its canvas implementation (or we realize that it is our fault after all)?
Yes I think now, considering how well this is behaving in Chrome and Safari, the issue really is with firefox.

Please, you can remove all OFC code js/tpl/swf/php code from the trunk :)

wow this is so nice that you did push the feature up to completion to this quality standards!

@timo-bes
Copy link
Member Author

  • Doing our best to speed up the "death" of IE7 & 8 sounds good for me ;-)
  • The bug concerning sparklines in overview pages has been fixed in [4808]
  • I'll start removing OFC. yay!

@timo-bes
Copy link
Member Author

(In [4813]) refs #2431 ofc removed. perfomance improvements. request size optimizations. general refactorings.

@mattab
Copy link
Member

mattab commented May 26, 2011

(In [4814]) Refs #2431 removing "flash export" on Widgets Screen, which feels good!

@mattab
Copy link
Member

mattab commented May 26, 2011

Ticket now fixed, just waiting for jqplot to fix the 100% pie bug but on the piwik, 100% complete and working.

Timo, amazing work from start to finish of this project! Kuddos...

@mattab
Copy link
Member

mattab commented Jun 6, 2011

@mattab
Copy link
Member

mattab commented Jun 6, 2011

(In [4882]) Fixes #2431

@timo-bes
Copy link
Member Author

timo-bes commented Jun 8, 2011

(In [4898]) Refs #2431 jqplot update

(sorry, forgot Refs in my original commit message)

@timo-bes timo-bes added this to the 1.5 - Piwik 1.5 milestone Jul 8, 2014
This issue was closed.
Sign up for free to join this conversation on GitHub. Already have an account? Sign in to comment
Labels
Critical Indicates the severity of an issue is very critical and the issue has a very high priority. Enhancement For new feature suggestions that enhance Matomo's capabilities or add a new report, new API etc.
Projects
None yet
Development

No branches or pull requests

3 participants